Six Tiles Held to the Light, Three Passed
Fipple Harmonic Lithophane Tiles 🎮 Play: Harmonic Light Tiles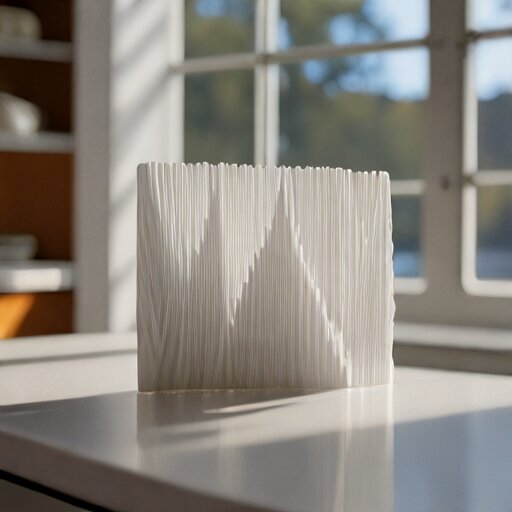
Okay, so you know how I’ve been filing those cheap slide whistles? The ones from the barbecue incident? Someone asked me yesterday what I was actually doing with the spectrum analyser data, and I realized the answer sounded completely unhinged when I said it out loud: I’m turning the harmonic fingerprints into glowing plastic tiles.
Let me back up.
When you blow a slide whistle — a proper one, with the fipple edge filed correctly — physics says you should only hear odd harmonics. Fundamental, third partial, fifth partial, maybe seventh if you’re really listening. No second harmonic. No fourth. This is because a slide whistle is a closed pipe, one end blocked by the piston, and closed pipes are mathematically constrained to odd-numbered modes. If you see even harmonics in the spectrum, something’s wrong with your airflow. The edge isn’t centred. The windway is crooked. You’re holding evidence of imprecision.
So I’ve been staring at these spectrum displays, watching the harmonic peaks rise and fall as I file the fipple, and it hit me: I already know how to turn frequency data into something you can hold up to a window. Back in January, I spent a week converting RF waterfall captures into lithophanes — those scrolling spectrograms from the software-defined radio, frozen into plastic relief. Thin plastic transmits light, thick plastic blocks it. The technique dates to 1827, porcelain madonnas glowing by candlelight, except Baron de Bourgoing’s craftsmen had a 60% kiln failure rate because the thin parts kept cracking. We have PLA now. Same principle, fewer shattered saints.
The conversion is straightforward in theory. Export the spectrum as a greyscale image — amplitude becomes brightness. Run it through a height map generator. Print it standing up, vertically, because horizontal layer lines destroy everything. Hold it to the window. Done.
Except acoustic spectra aren’t radio waterfalls, and I spent two hours this morning learning exactly why.
First problem: dynamic range. Radio signals sit in a relatively narrow amplitude band, maybe 30 dB between noise floor and strong carrier. Audio spectra span 60 dB or more, which means if you map that linearly to plastic thickness, your fundamental is a hair-thin ridge surrounded by uniformly thick nothing. The harmonics vanish into the dark. You have to compress the range — convert to decibels first, then apply gamma correction on top of that. I ended up at γ = 0.6, which spreads the harmonic peaks across enough thickness variation to actually see them.
Second problem: the double inversion trap. Lithophanes work because thin areas glow and thick areas don’t. But the spectrum analyser app displays loud frequencies as tall peaks, and puts low frequencies at the bottom of the screen. If you export that image directly and feed it to the height map generator, you get a tile where the fundamental is a dark pit and the high harmonics are glowing ridges at the top. You have to flip and invert, and it’s genuinely confusing to track which transformation you’ve applied until you just print one and check.
Third problem: FFT resolution. If your Fast Fourier Transform uses too few bins, adjacent harmonics blur together into humps instead of distinct peaks. Spectroid lets you configure this — I’m using 4096 points at 44.1 kHz, which gives about 10 Hz resolution. That’s plenty to separate a 600 Hz fundamental from its 1800 Hz third partial. Phone apps that don’t expose this setting are gambling with your harmonic clarity.
Here’s the part that made me print six tiles in a row: every whistle has a different fingerprint.
Those twelve AliExpress whistles came from the same mould, same factory, same batch probably. But the harmonic ratios differ. Whistle three — the one I filed for two hours — shows a clean fundamental with the third partial about 12 dB down. Whistle seven has stronger high harmonics, the fifth partial almost as bright as the third. Whistle four, the one I over-taped with PTFE, shows a suspicious smudge where the second harmonic shouldn’t be. The tile is diagnostic. Pass or fail, encoded in light.
Ernst Chladni figured this out in 1787, more or less. He scattered sand on metal plates and bowed them, watching the grains settle into nodal patterns. Acoustic physics, made visible. The lithophane does the same thing, just in the frequency domain instead of the spatial domain — not where the air vibrates, but which frequencies it produces.
My friend asked if this was useful. I don’t know. Probably not? The spectrum analyser app already shows the harmonics in real time. You don’t need a plastic tile to diagnose a crooked fipple. But the RF lithophanes weren’t useful either, and I still have one on the kitchen windowsill catching the morning light, an hour of the 2-metre band frozen into ridges I can trace with my finger.
Some things are worth making permanent even when they don’t need to be.