Seven Days of Pressure Before the Paper Remembered Cliffs
Barograph Chart Art 🎮 Play: Storm Scribe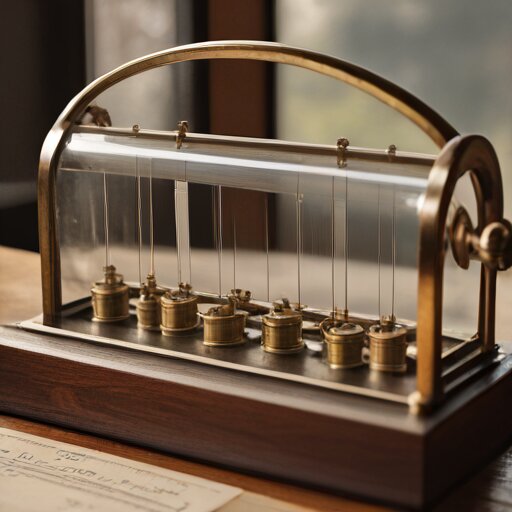
So a barograph is basically a barometer that learned how to draw. You know those aneroid barometers — the brass things with a dial and a needle that moves when the weather changes? Imagine one of those, except instead of pointing at a number, it holds a pen. And instead of pointing at a fixed dial, the pen rests against a paper drum that rotates once every eight days, driven by clockwork. The pen just sits there, tracing, inscribing whatever the atmosphere happens to be doing.
I found mine at an estate sale. Sixty dollars, no provenance, glass dome dusty but uncracked. The guy running the sale said it had belonged to his grandfather, a farmer who “liked knowing when storms were coming.” I asked if the clockwork still ran. He shrugged. Fair enough.
The thing that got me interested — and you’re going to think this is ridiculous, but stay with me — is that barograph charts look like landscape paintings. A week of stable high pressure draws a flat horizon line with gentle swells. A cold front passing through carves a sudden valley. Pressure dropping ahead of a storm looks like the pen fell off a cliff. These aren’t intentional compositions, they’re just what happened, but the result is weirdly beautiful. Abstract expressionism by accident, rendered in fountain pen ink on graph paper.
I say fountain pen ink because the original inks are long gone. The forums recommend Pelikan 4001, which flows well enough to track small changes without blobbing. Ink viscosity matters here — if it’s too thick, the pen drags, and the friction masks the delicate movements you’re trying to capture. Victorian instrument makers obsessed over nib pressure for exactly this reason. The pen arm has to barely kiss the paper. Too heavy and you lose resolution; too light and the line skips.
The clockwork inside is simpler than I expected after wrestling with that twelve-dollar pocket watch earlier this year. A barograph drum rotates once in eight days — no balance wheel, no escapement ticking six times per second, just a slow gear train with plenty of tolerance. Wind it when you change the chart and forget about it. Except my drum was running about four hours fast per week, which meant Thursday’s weather was appearing on Wednesday’s grid lines. I adjusted the regulator, a small arm on the mainspring that changes the effective length of the oscillator, and now it drifts less than an hour over seven days. Good enough for art, even if a meteorologist would scold me.
The sensing element is where it gets clever. A single aneroid capsule — a sealed metal bellows with most of the air evacuated — moves less than a tenth of a millimetre per millibar of pressure change. Useless for drawing anything. So vintage barographs stack five, six, sometimes seven capsules in series, each one amplifying the motion until the total deflection is maybe twelve millimetres across the normal pressure range. These are called Vidie cans, after Lucien Vidi, the French inventor who patented the design in 1844. If even one can develops a leak, the whole stack’s calibration goes wrong. I haven’t tested mine yet. I’m choosing to believe they’re fine.
Here’s the part that surprised me: even when nothing is happening weatherwise, the barograph still draws something. Atmospheric pressure follows a twice-daily rhythm — peaks around 10 AM and 10 PM, dips around 4 AM and 4 PM — caused by thermal expansion of the atmosphere as the sun heats it. The amplitude is tiny, maybe a millibar or two, but a sensitive barograph will trace this diurnal wave even during a week of perfectly boring weather. The atmosphere breathes twice a day, and the pen records it. I think about that a lot: the sky’s pulse, invisible, inaudible, inscribed on paper by a machine designed in the 1840s.
The chart I’m running this week is mostly flat with a gentle rise toward the weekend — a high pressure system settling in, according to Environment Canada, though I could have told you that from the trace. One advantage of analog recording: you don’t need to check an app to see trends. The shape is right there, inscribed in time, exactly as it happened, without interpretation or summary. The sundial I started building two days ago captures time as shadow geometry. This captures weather as movement. Both are the same basic idea — let the world write on paper without asking for permission.
I’m not sure what I’ll do with the finished charts. Frame them, maybe. Or file them by date, building an archive of pressure landscapes. Some collectors overlay multiple weeks from different years, looking for patterns that repeat. There’s a whole aesthetic vocabulary in these traces that I’m only beginning to read — the sharp drops, the slow climbs, the flat plateaus of stubborn highs that just won’t move.
The pen is moving right now, drawing whatever today becomes. I’m trying not to check it too often.